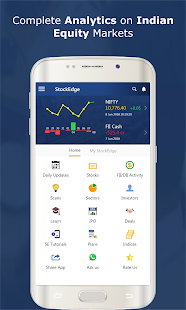
StockEdge is the ONLY mobile based app in India, which is 100% focused on research and analytics. It empowers the users to do self research by providing all necessary tools which are relevant for doing FUNDAMENTAL RESEARCH, TECHNICAL RESEARCH, DERIVATIVES RESEARCH in very SIMPLE TO UNDERSTAND framework.
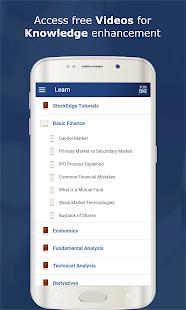
StockEdge is India's best and the fastest growing Equity markets analytics and research App, primarily based on NSE and BSE data. It helps the Indian Stock market Traders and Investors take better decisions by providing them with awesome end-of-day analytics, visualizations and alerts on the mobile platform in a highly customizable and adaptive form to suit individual needs. It also helps the young population to learn about various facets of equity markets through Learn section and at the same time analyse the market data in best possible manner.
StockEdge is part of the vision of making Indian retail aware about the opportunities available for creating wealth in Indian Equity Market. We do not promote intraday trading, thus we would like the traders/ investors to look at end of the day analytics for sustainable price movement in a stock.
Features provided in the app include :-
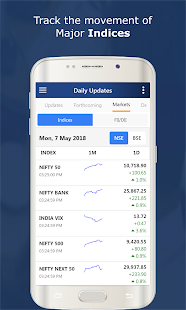
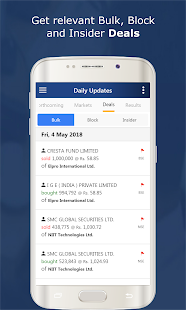
1. Daily Updates Section for filtered major market tracking with News, NSE & BSE Corporate Announcements, Forthcoming events, & Corporate Actions, Market Indices NIFTY, BANK NIFTY, INDIA VIX, NIFTY 500, MIDCAP, IT, CPSE last month performance graph, FII Snapshot, Daily Bulk Deals, Daily Block Deals, Insider Updates, Daily Result announcements.
2. FII/ FPI & DII Cash and Derivatives with strong historical data visualisation Daily, Monthly & Yearly
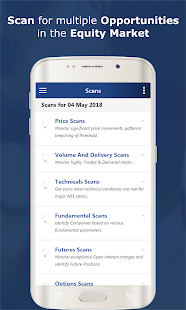
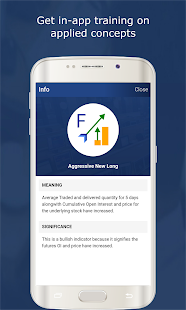
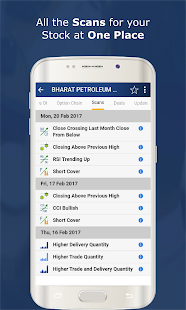
3. Opportunity Scans: Price Scans, Last week high/ low, Last Month high/ low, 52 week high/low, 3 days price behavior, 1 day price behavior, High Volume Stocks, High Delivery Stocks,Technical based Daily Scans, RSI, Moving average, Commodity Channel Index etc, Candlestick pattern scans, Derivatives scans, Open Interest, Agressive Longs, Aggressive Shorts, Long coverings, Short coverings, Options Strike Scans etc
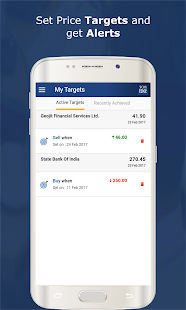
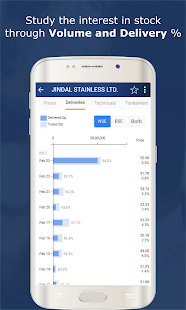
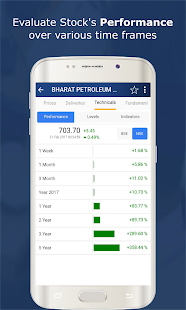
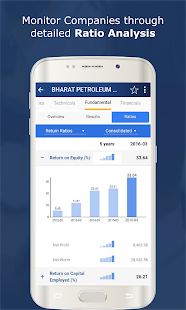
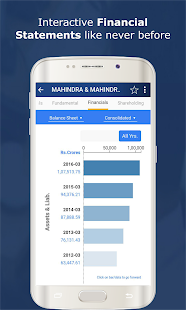
4. Stock Research: Price graph (Intraday [BSE: 5 Min, NSE: 15 Min], 1M, 3M, 1Y, 2Y, 5Y), Weekly & Monthly High, Low, Close Martix, Delivery & % of Total Volume graphically, Fundamental review, Detailed Results Quarterly/Semiannual/Annual with interactive graphs comparison of last 5 periods, Standalone & Consolidated, Ratio Analysis, Return Ratios, Efficiency Ratios, Growth Ratios, Solvency Ratios, Cash Flow Ratios, Valuation Ratios, Interactive Balance Sheet, Profit and Loss statement, Cash Flow Statement, Shareholding Pattern, Major Shareholders since last 5 years, Major Technical levels, Daily Scans related to the stock, Bulk Deals, Block Deals, Insider Activities, Updates: News, Announcements, Corporate Actions, Google Feeds etc, Setting Target price for alerts.
5. Sector Research: Sector List, Industries in a sector, Companies in a sector/Industry, Price Movement of last 30 days presented in simple graph, Gainers, Losers etc
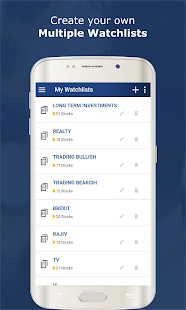
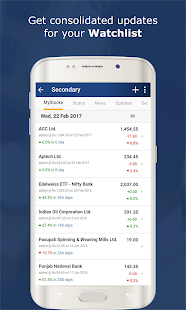
6. Keep track of stock portfolio in multiple groups using MyWatchlist section. Each Market Watch can fulfill separate objectives. Use this facility to create market watch in name of individuals, sectors, themes, geographies etc.
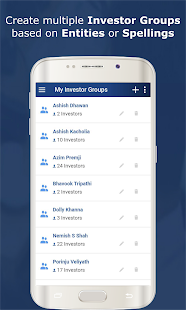
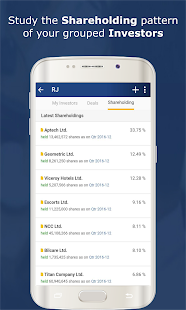
7. Track what Big Indian Investors are doing. Use MyInvestorGroup section to create your own group of Investors with their multiple names/entities etc. Look at consolidated deals, insider activities, shareholding etc. Navigate from investor to shareholder list to company to shareholder to investor and add new names in the group and expand the research.
8. Create favorite daily scanners for daily trading using MyScans section. We keep adding new scans, you keep adding new ones as your favorite for fastest usage and effective results.
9. Learn about Capital Markets, Financial Markets, Equity, Derivatives, Technical Analysis, Fundamentals, Economics, Commodity, Currency etc. with simple interface and very effective short videos.
